
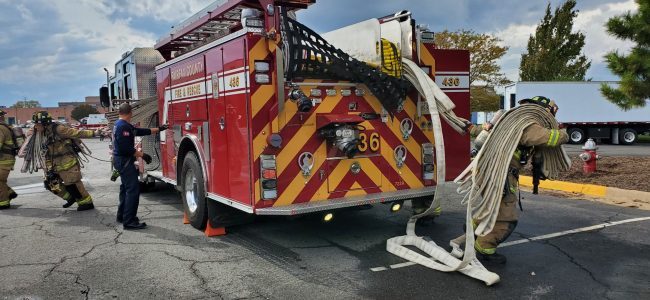
The numbers behind every response.
How often we're called, how fast we arrive, what happens next, and who and what we send.
Calls
133,368incidents in fiscal year 2025. That is one every four minutes, around the clock.
| FY2023 | 125,932 |
|---|---|
| FY2024 | 130,196 |
| FY2025 | 133,368 |
Fiscal years run July to June. Source: FY2027 Advertised Budget.
What we’re called for
| Emergency medical | 85,505 | 74% |
|---|---|---|
| Fire | 13,922 | 12% |
| Non-emergency service | 11,311 | 9.8% |
| Hazardous materials | 1,646 | 1.4% |
| Other emergencies | 1,640 | 1.4% |
| Technical rescue | 881 | 0.8% |
Calendar year 2023. Source: 2023 Standards of Cover.
- patients taken to hospitals in fiscal year 2025
- 66,488patients taken to hospitals in fiscal year 2025
- of cardiac arrest patients reached the emergency department with a pulse
- 58.2%of cardiac arrest patients reached the emergency department with a pulse
- in property saved by fire suppression
- $1.4 billionin property saved by fire suppression
- new career firefighters graduated from four recruit schools
- 139new career firefighters graduated from four recruit schools
Response times
How often we met each goal in fiscal year 2025, with the two years before for comparison.
- 59.5%First engine at a structure fire within 5 minutes 20 seconds
FY2023: 58.3%, FY2024: 59.1%
- 94.2%15 firefighters at a structure fire within 9 minutes 20 seconds
FY2023: 91.1%, FY2024: 89.2%
- 72.6%Advanced life support unit on scene within 9 minutes
FY2023: 76.1%, FY2024: 75.3%
- 55.0%Defibrillator on scene within 5 minutes
FY2023: 58.5%, FY2024: 56.7%
- 58.2%Cardiac arrest patients reaching the emergency department with a pulse
FY2023: 45.9%, FY2024: 52.9%
Year by year
| Measure | FY2023 | FY2024 | FY2025 |
|---|---|---|---|
| Total incidents | 125,932 | 130,196 | 133,368 |
| Fire loss | $13.8 million | $26.3 million | $17.9 million |
| Civilian fire deaths | 5 | 2 | 6 |
| Civilian burn injuries | 12 | 22 | 28 |
| Fire investigations | 267 | 348 | 385 |
| Fire inspection activities | 25,169 | 28,849 | 27,301 |
| Fire protection systems tests | 8,016 | 8,631 | 7,255 |
| Preschool and kindergarten students taught | 7,850 | 7,765 | 10,136 |
| Older adults taught | 4,033 | 3,377 | 2,486 |
| Patient encounters where a File of Life was used | 2,617 | 2,952 | 4,089 |
| Times a volunteer-staffed unit went in service | 1,420 | 1,378 | 1,560 |
| New career firefighters trained | 104 | 72 | 139 |
Fiscal years run July to June. Source: Fairfax County FY2027 Advertised Budget.
Workforce
- uniformed positions
- 1,417uniformed positions
- civilian positions
- 206civilian positions
- operational volunteers
- 490operational volunteers
- on duty every day, at minimum, on 131 units
- 363on duty every day, at minimum, on 131 units
Positions are those authorized in the FY2027 Advertised Budget. Volunteer count is for 2025.
Operations Bureau by rank
| Fire Technicians | 566 |
|---|---|
| Firefighters | 427 |
| Lieutenants | 168 |
| Captains | 154 |
| Battalion Chiefs | 32 |
| Deputy Chiefs | 9 |
| Assistant Chief | 1 |
Fleet
- engines
- 39engines
- ladder trucks
- 14ladder trucks
- heavy rescues
- 8heavy rescues
- advanced life support medic units
- 23advanced life support medic units
- basic life support ambulances
- 20basic life support ambulances
- tankers
- 6tankers
- brush trucks
- 11brush trucks
- boats, including 2 fire boats
- 14boats, including 2 fire boats
Source: 2023 Standards of Cover.
Annual reports
 Annual Report (CY2025)62 pages
 Annual Report (CY2024)62 pages
 Annual Report (CY2023)67 pages
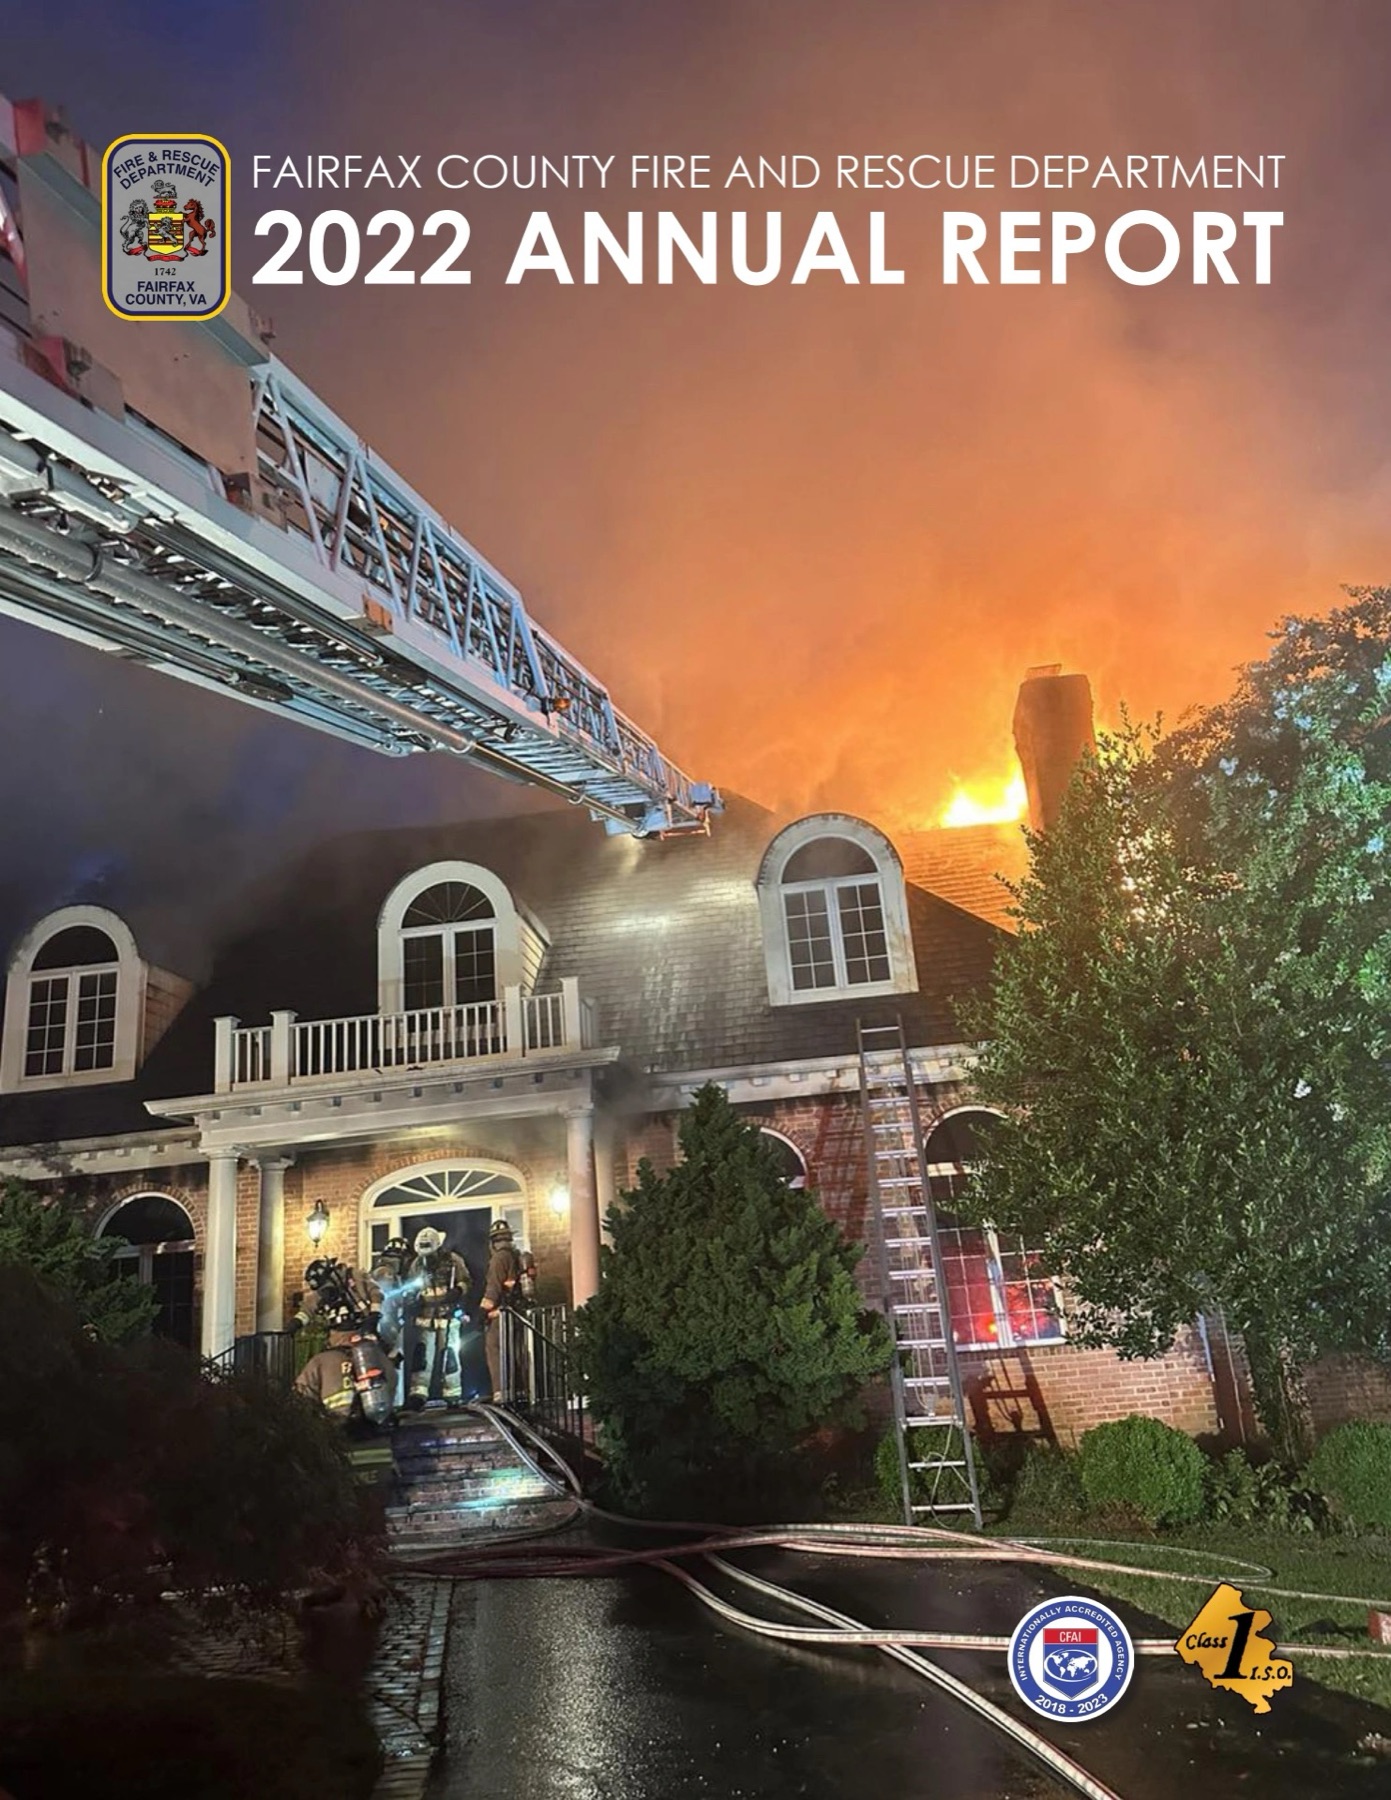 Annual Report (CY2022)64 pages
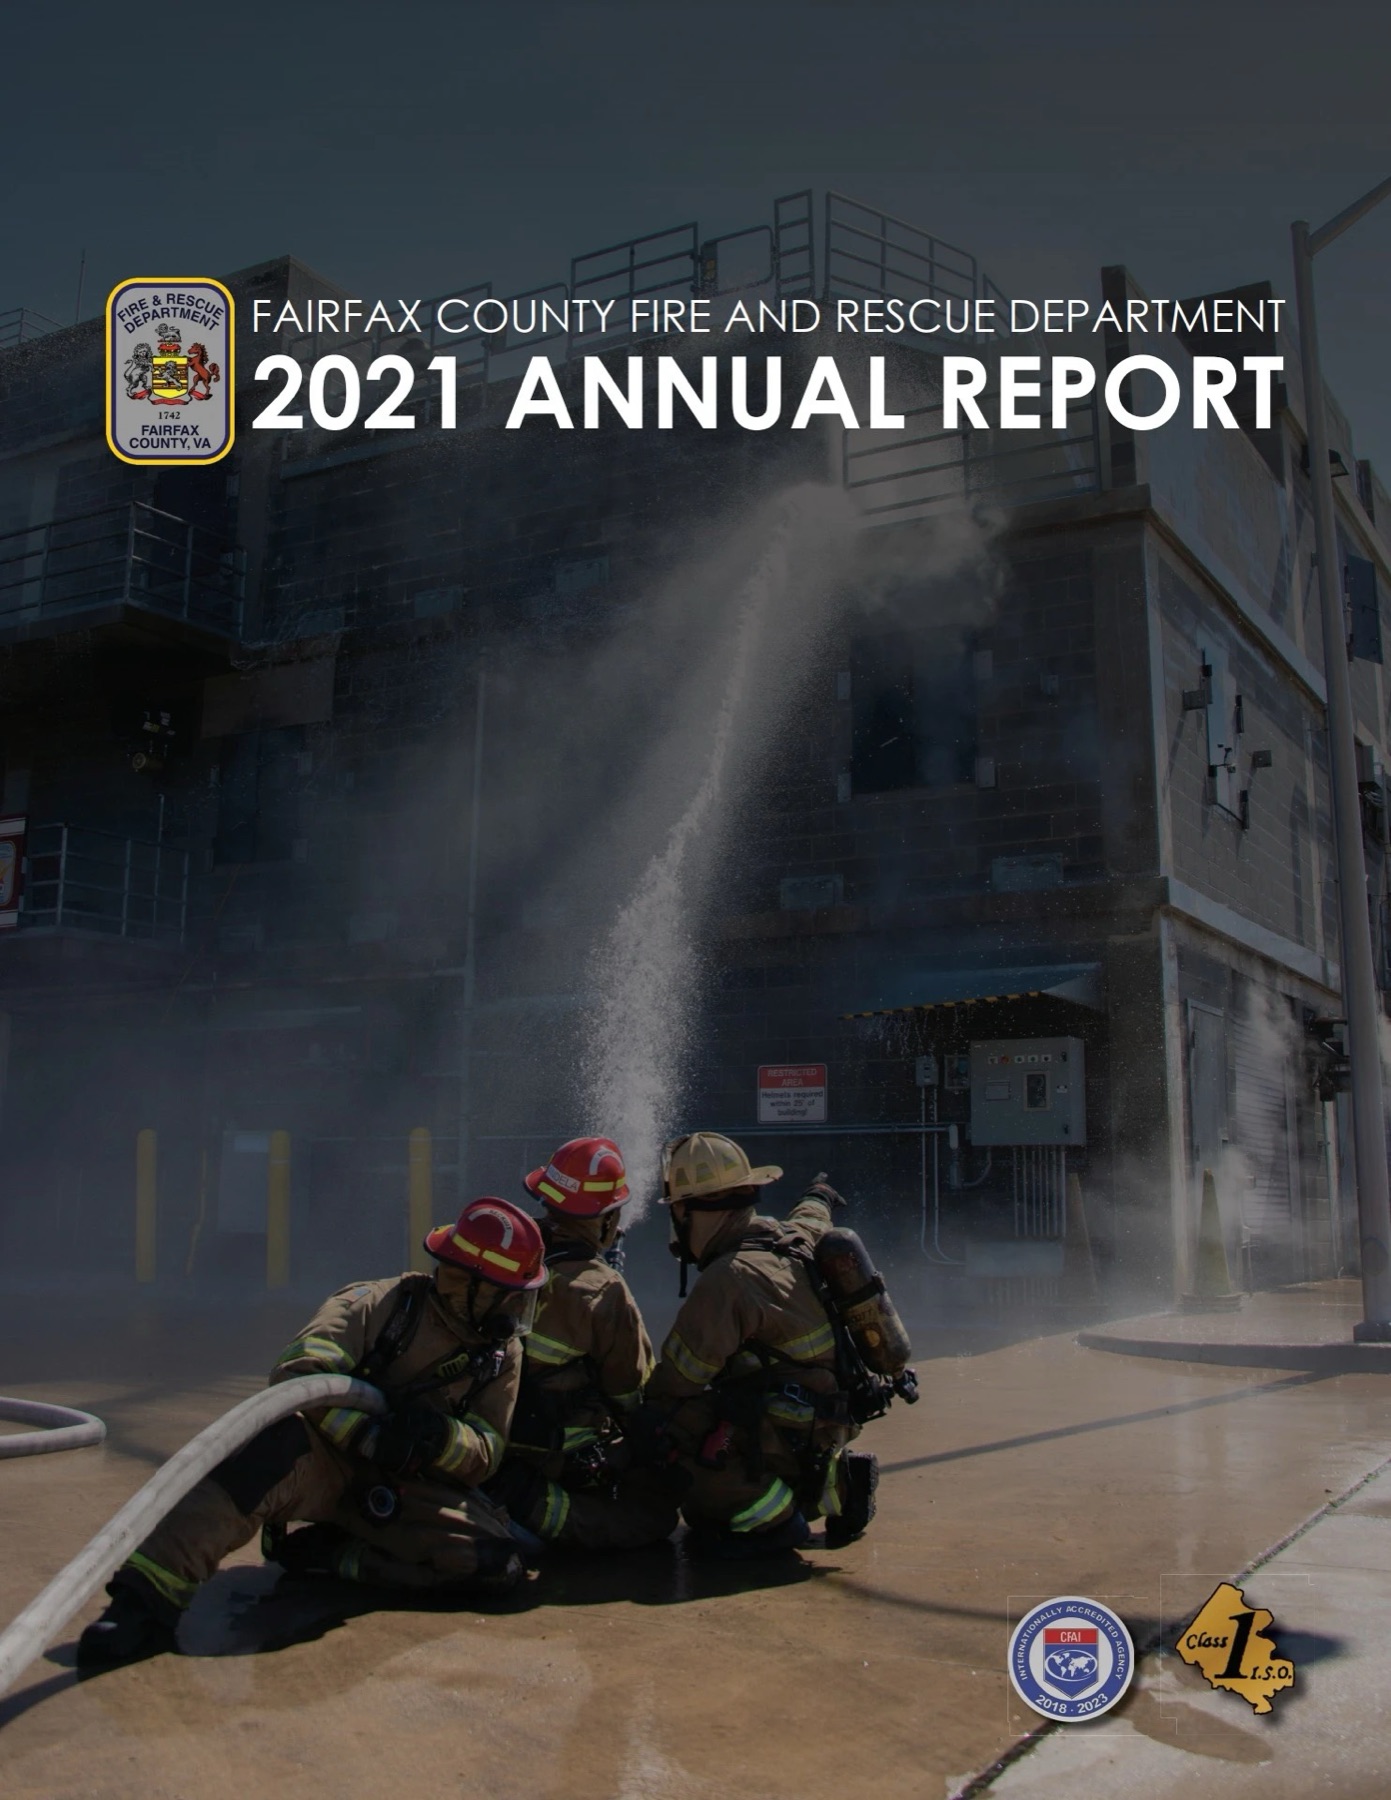 Annual Report (CY2021)56 pages
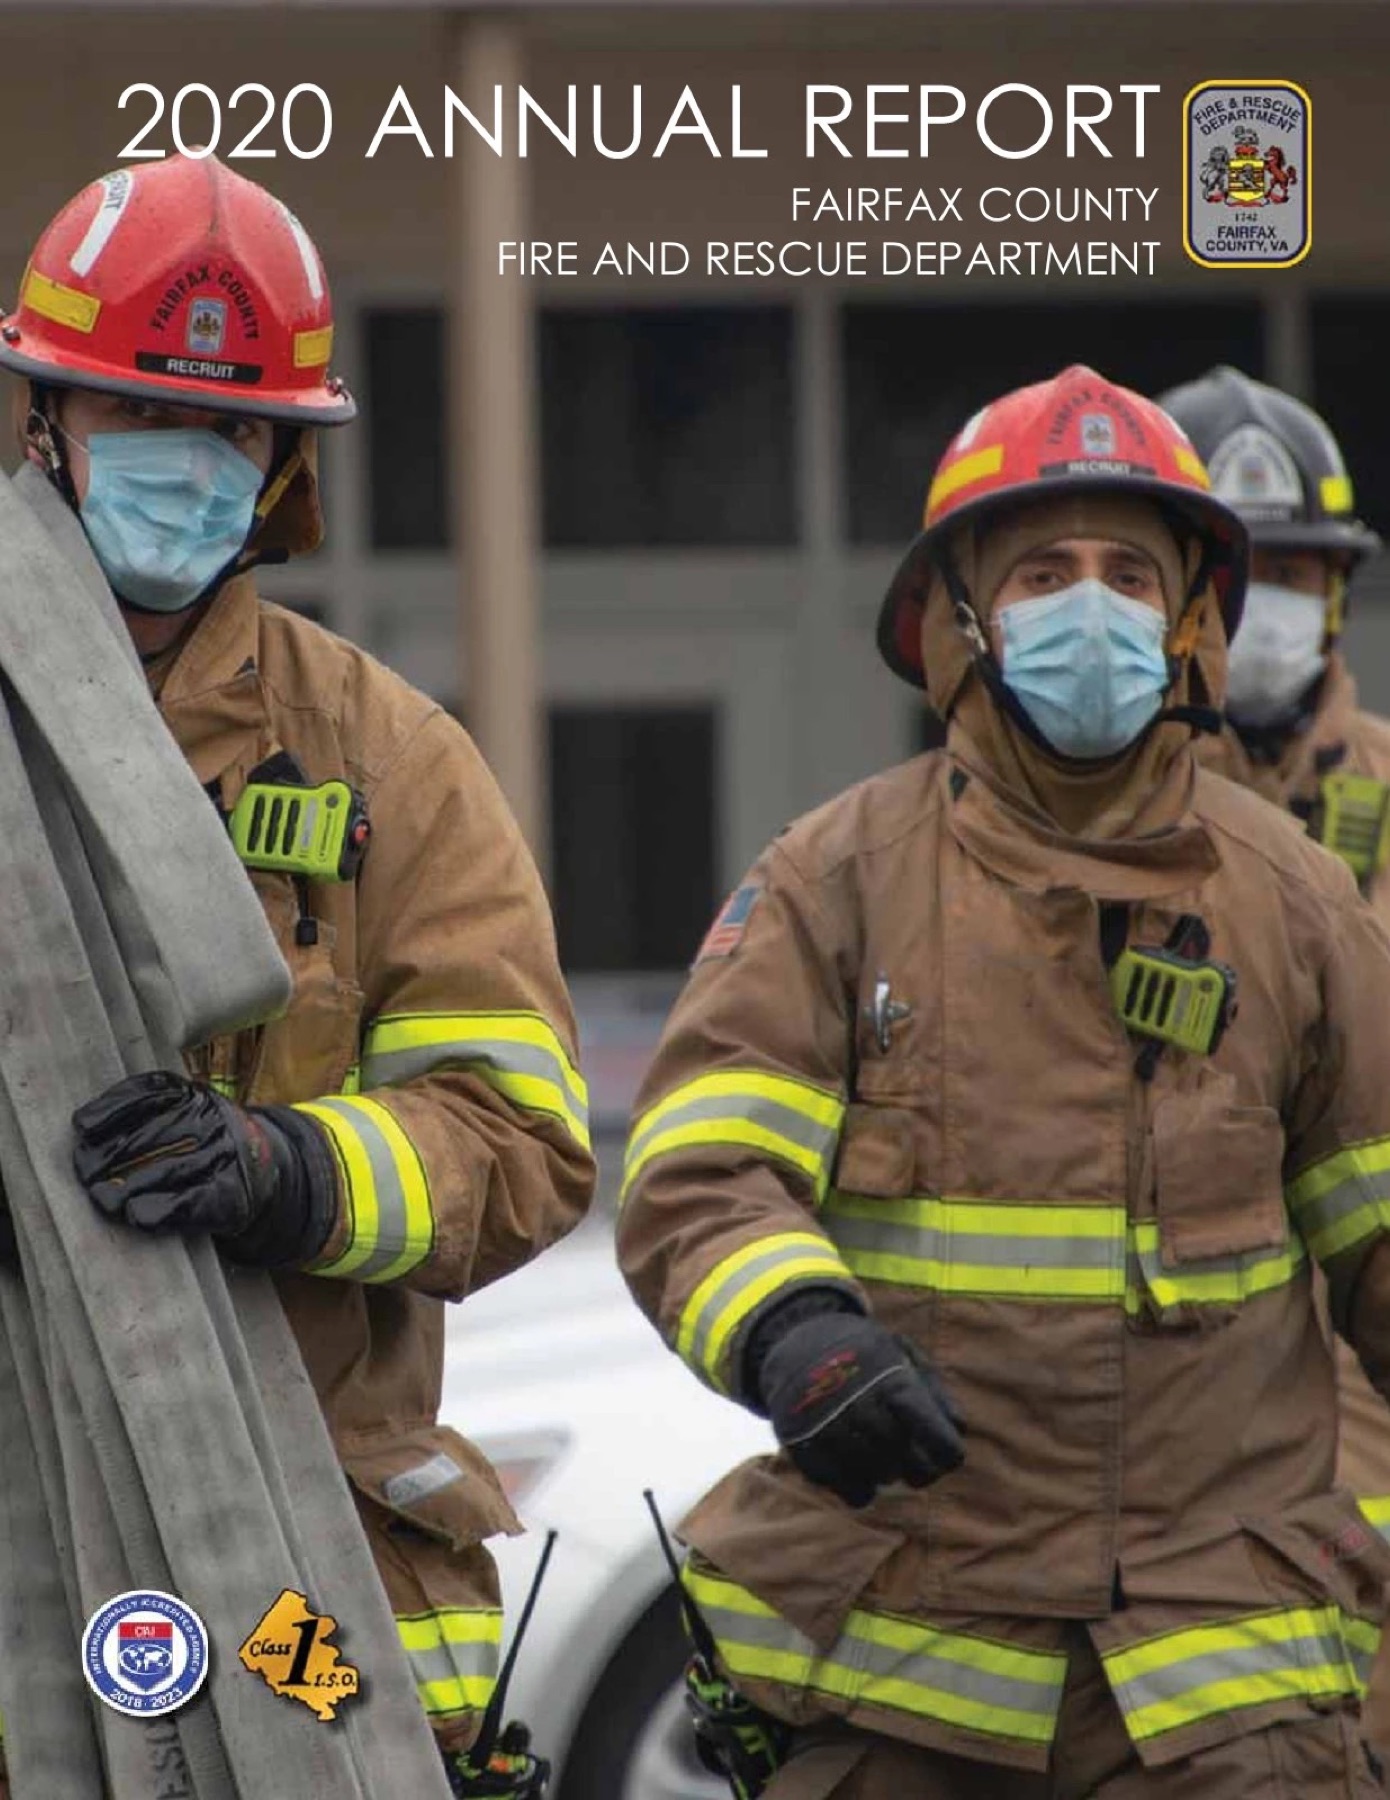 Annual Report (CY2020)52 pages
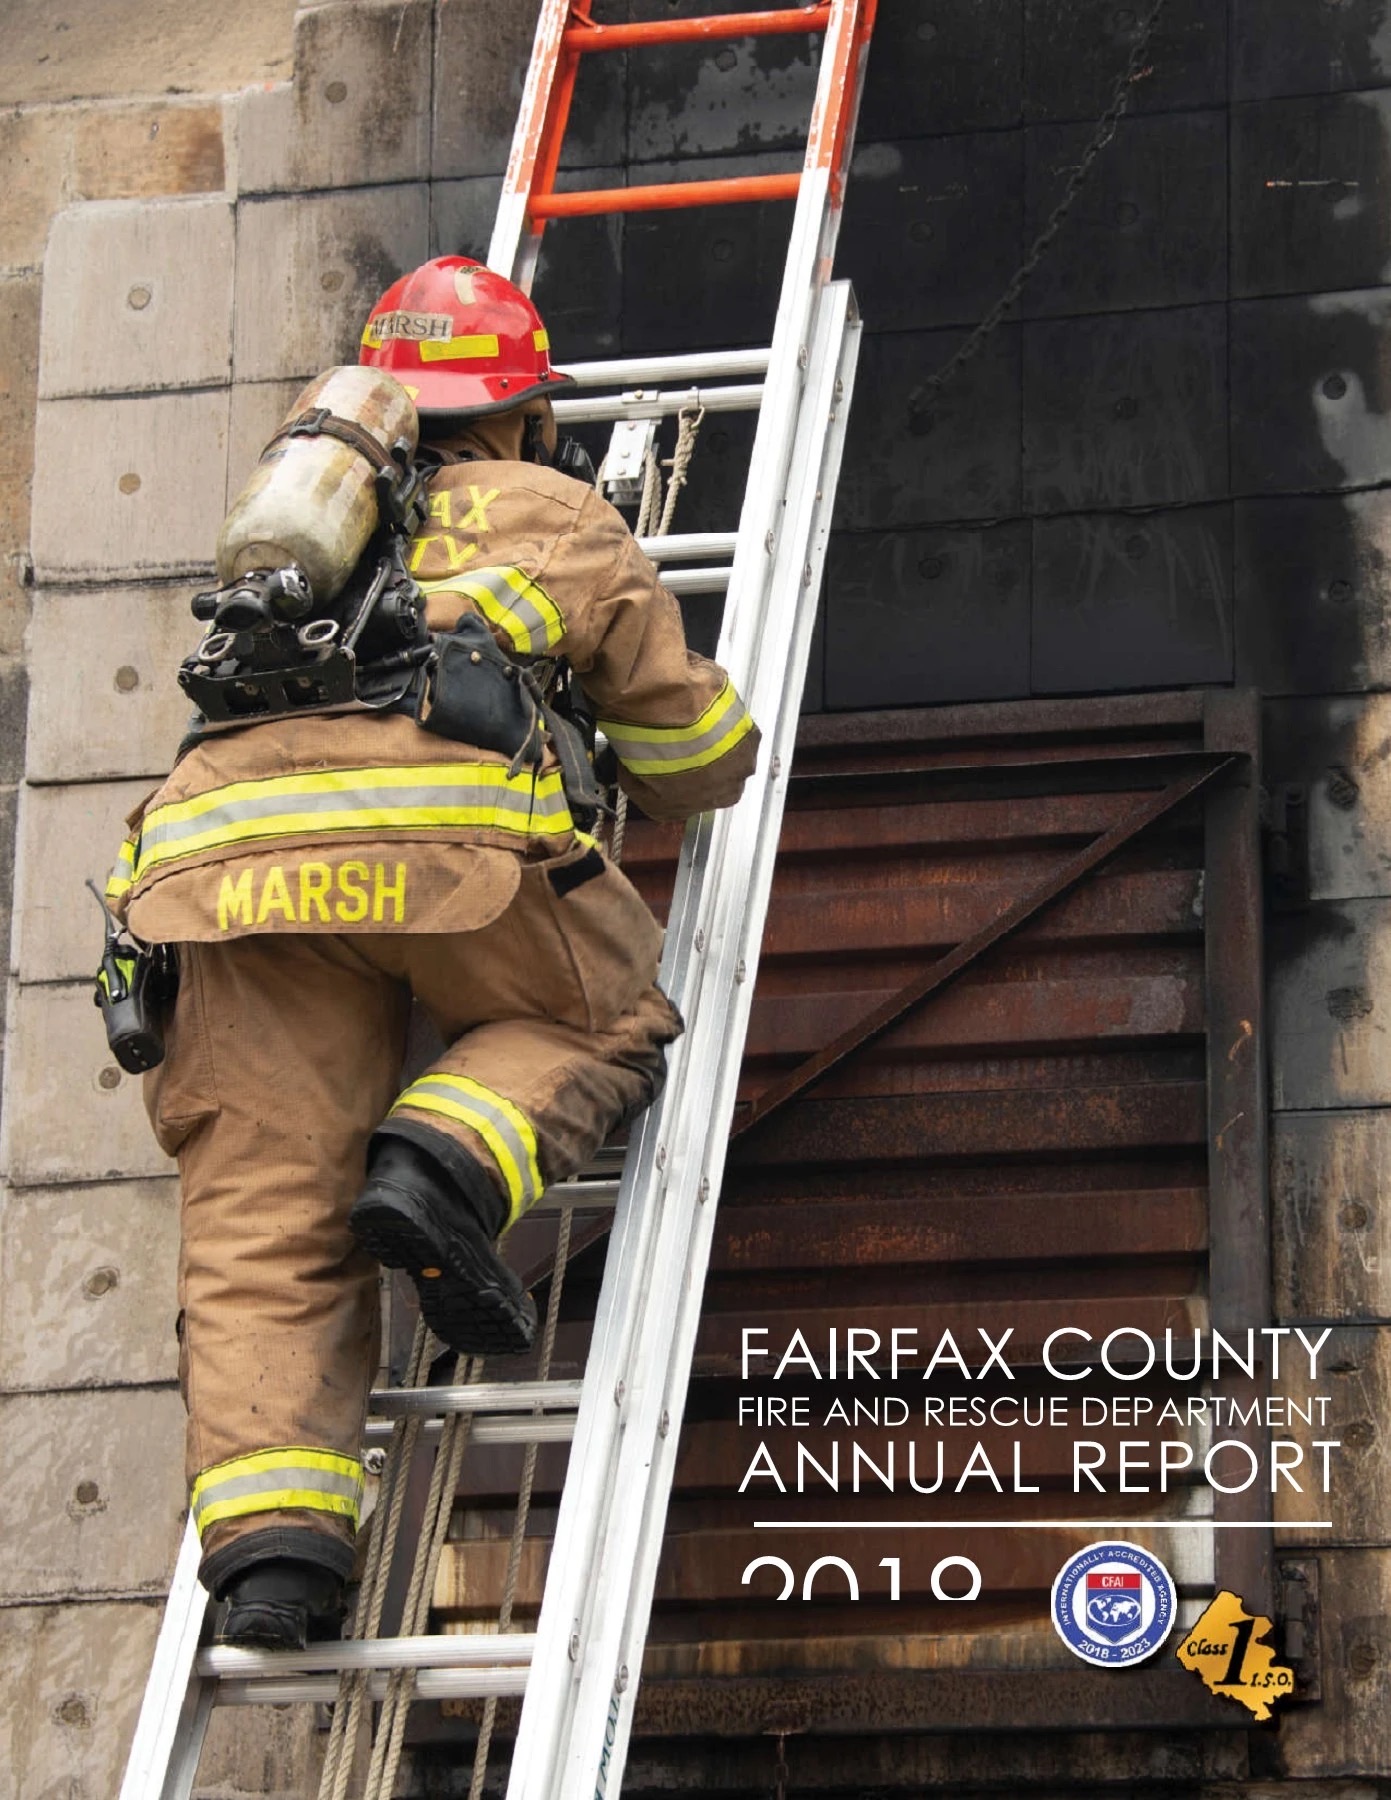 Annual Report (CY2019)52 pages
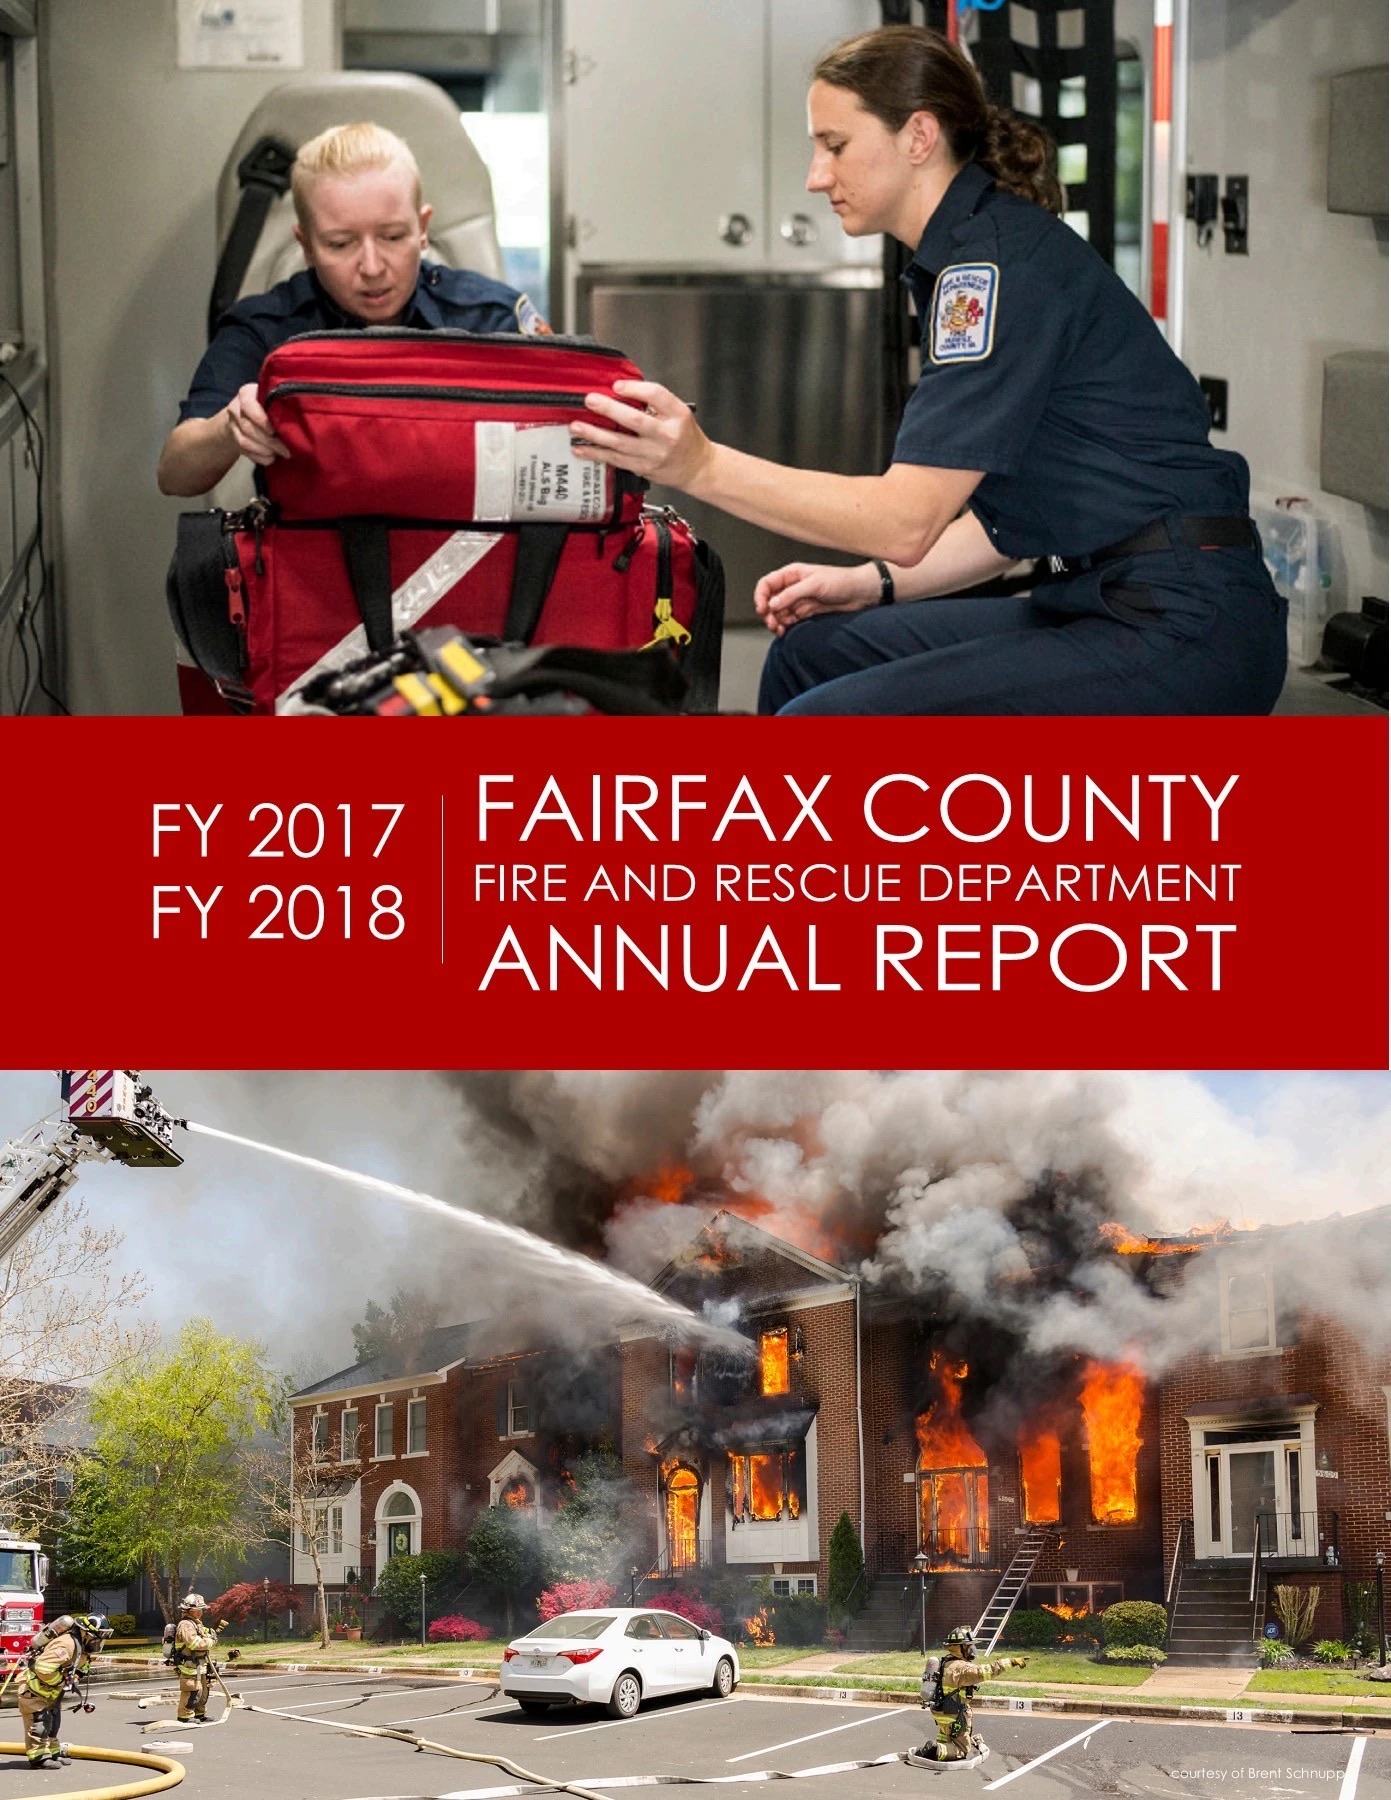 Annual Report (FY2017 - FY2018)52 pages
- 20162016 Annual Summary2016 Annual SummaryRead on this site
- 20152015 Annual Summary2015 Annual SummaryRead on this site
- 20142014 Annual Summary2014 Annual SummaryRead on this site
- 20132013 Annual Summary2013 Annual SummaryRead on this site
- 20122012 Annual Summary2012 Annual SummaryRead on this site